 TOP, The Output Processor®
Software for Visualizing Monitoring Data and Simulation Results
About TOP
TOP reads data from a variety of sources and transforms it into high quality graphics for inclusion in reports and documents. TOP was developed by Electrotek Concepts® to visualize data from a variety of simulation and measurement programs.
TOP reads data from a variety of sources and transforms it into high quality graphics for inclusion in reports and documents. TOP was developed by Electrotek Concepts® to visualize data from a variety of simulation and measurement programs.
Data formats supported include
- ASCII Text
- COMTRADE: IEEE Std C37.111-1991 | IEEE C37.111-1999
- PQDIF: Power Quality Data Interchange Format - IEEE Std 1159.3-2002
- Dranetz 8010 and 8020 PQNode®
- Dranetz 65x Series
- Electrotek SuperHarm®
- Electrotek FerroViewTM
- EPRI/DCG EMTP for Windows
- ATP (Alternative Transients Program)
- PSCAD® - Versions 3 and 4
- EPRI HARMFLO for Windows
- Cooper Power Systems V-HARMTM
- EPRI SDWorkstation
- EPRI LPDW (CFlash, DFlash, TFlash)
- EPRI PQ Diagnostic System (Capacitor Switching "&" Lightning)
- Square D PowerLogic® (using DADisp format)
- Fluke 41
TOP utilizes the Microsoft® Windows®* graphical user interface to simplify usage of the program. TOP takes advantage of the Windows clipboard to allow easy transfer of data to other Windows programs.

Output Formats
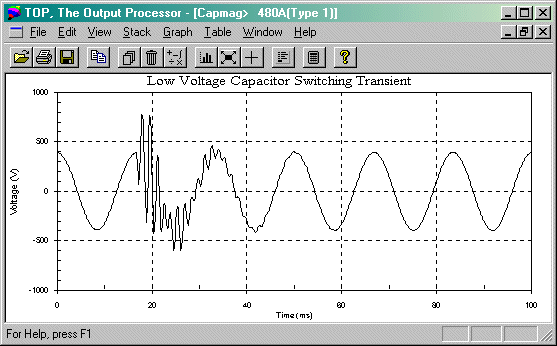
TOP provides a number of ways to visualize data as tables and graphs. Typical presentation modes include
TOP provides a number of ways to visualize data as tables and graphs. Typical presentation modes include
- Waveform & Spectrum Plots
- Frequency Response Plots
- Summary Tables (including IEEE Std 519 application)
- Summary Bar/Column Charts
- Cumulative Probability Plots
- Probability Density Charts
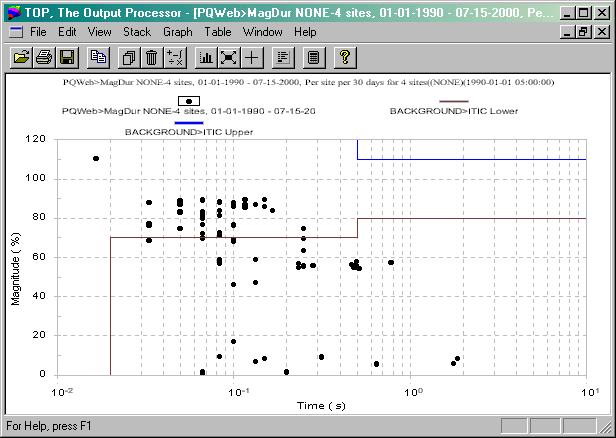
- 3D Magnitude-Duration Histograms (downloaded from PQWeb®)
- Background (CBEMA, ITIC, etc.) Curves for Magnitude-Duration Plots

TOP utilizes Microsoft's Multiple Document Interface (MDI) to allow you to simultaneously view several different plots in multiple windows. You can move, size, and arrange the windows on the screen as desired, and any window can be printed at a command or keystroke. Because of the functionality offered by Microsoft Windows, TOP does not need to be updated every time a new printer or display device is installed.
The data displayed in any window can also be exported to a file or pasted to the Windows clipboard in a variety of graphical, numerical, or text formats. Supported export formats include
- PQDIF (.PQD)
- COMTRADE (.CFG)
- Windows Metafile (.WMF)
- Portable Network Graphics (.PNG)
- Comma Separated Value (.CSV)
- ASCII Tabbed Text (.TXT)
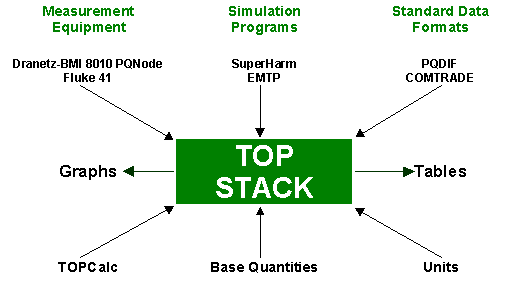
TOP manipulates the data to be displayed using a mechanism called the stack (illustrated below). First, you select a file that contains the data to be visualized. TOP then generates a dialog box displaying all of the quantities (objects) available in the current file.
You then select the items of interest, which TOP loads into memory. This process is similar to selecting a file folder from a file cabinet, selecting specific papers in the file that are of interest, and piling them in a stack on your desk.
You can reactivate the dialog box at any time and load more data objects onto this stack. You can also select another file at any time and load data from that file onto the stack. The result is a stack of data objects of potentially different types and origin that are now available for visualization. You can now select one or more of the items on the stack and request TOP to display that data in one of the many tabular or graphical formats.

TOP includes a feature called TOPCalcTM. TOPCalc allows you to perform mathematical operations on the various supported data objects. These operations include
- Addition, subtraction, multiplication, division
- Inversion, absolute value
- Fast Fourier Transformer (FFT)
- Inverse Discrete Fourier Transform (IDFT)
- Square, square root
- Power, energy, I2t, X-Y combine, integrate
- Filter, time shift
- Cumulative probability
- Probability distribution
- Waveform sampling
Tidak ada komentar:
Posting Komentar